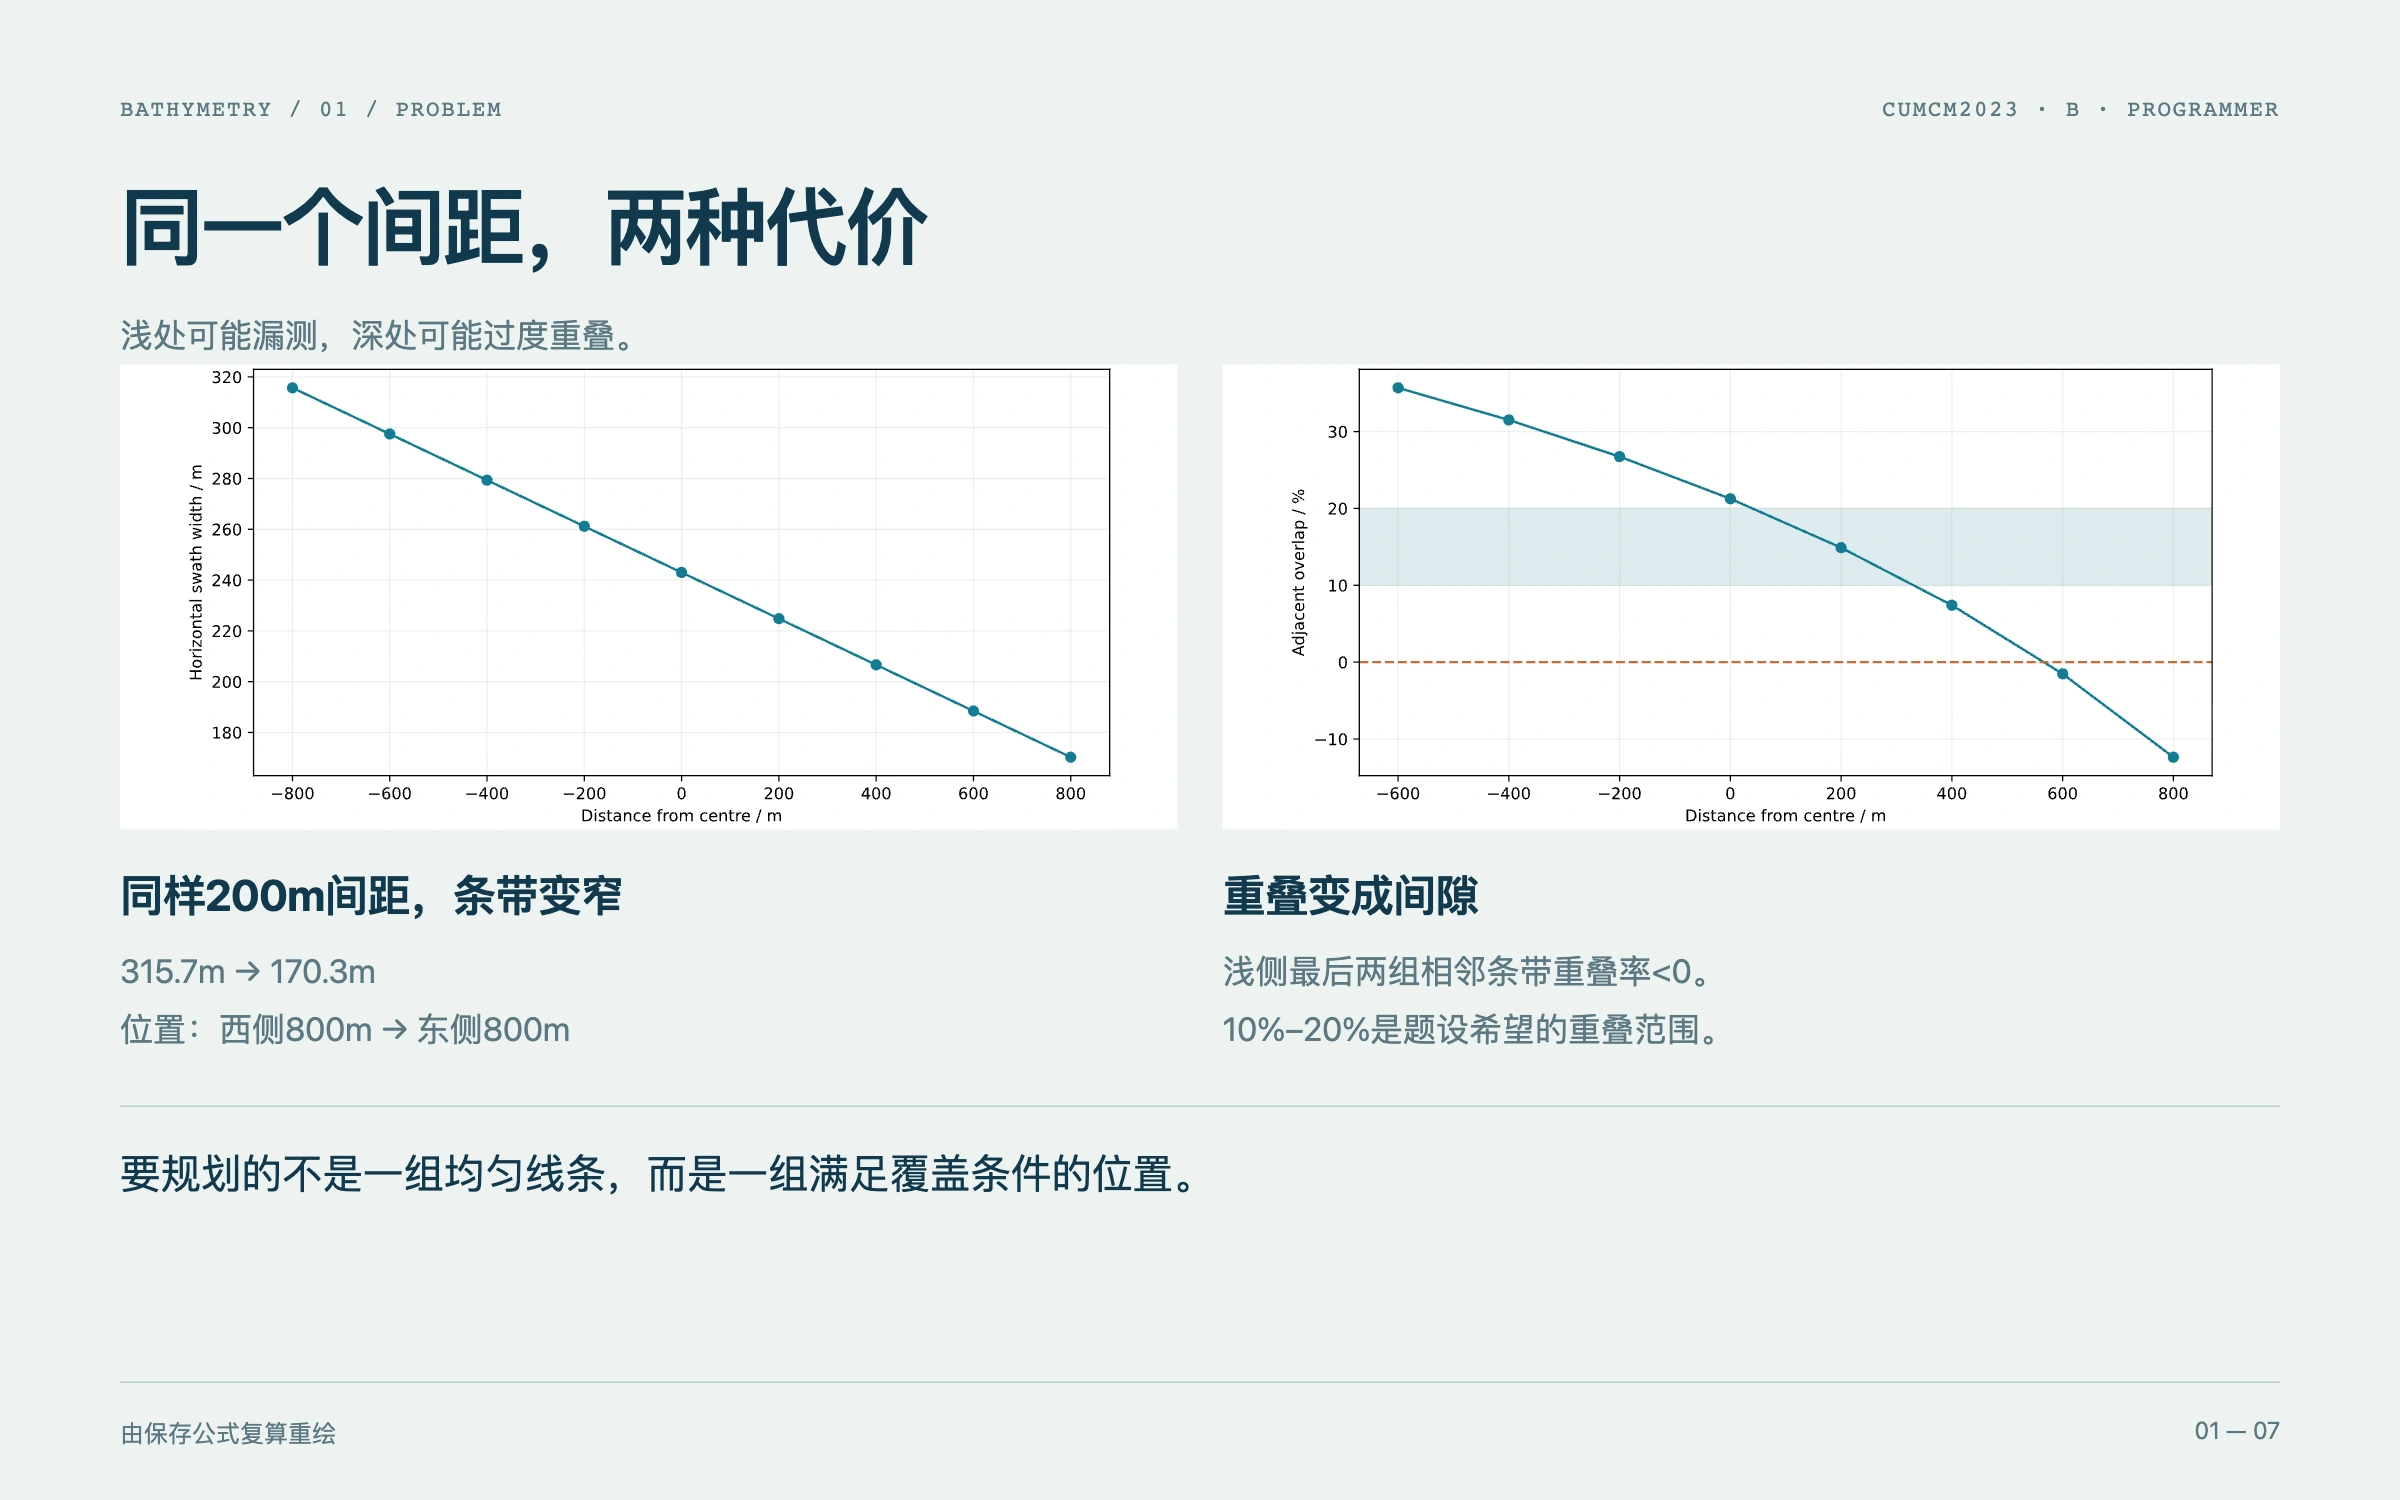
The problem with fixed spacing
Beam coverage changes with depth and slope. A fixed 200m spacing in Problem 1 produces calculated widths from 315.7m down to 170.3m, with negative overlap in the last two adjacent strips. Survey planning therefore has to consider coverage, repeated scanning, and line length together.
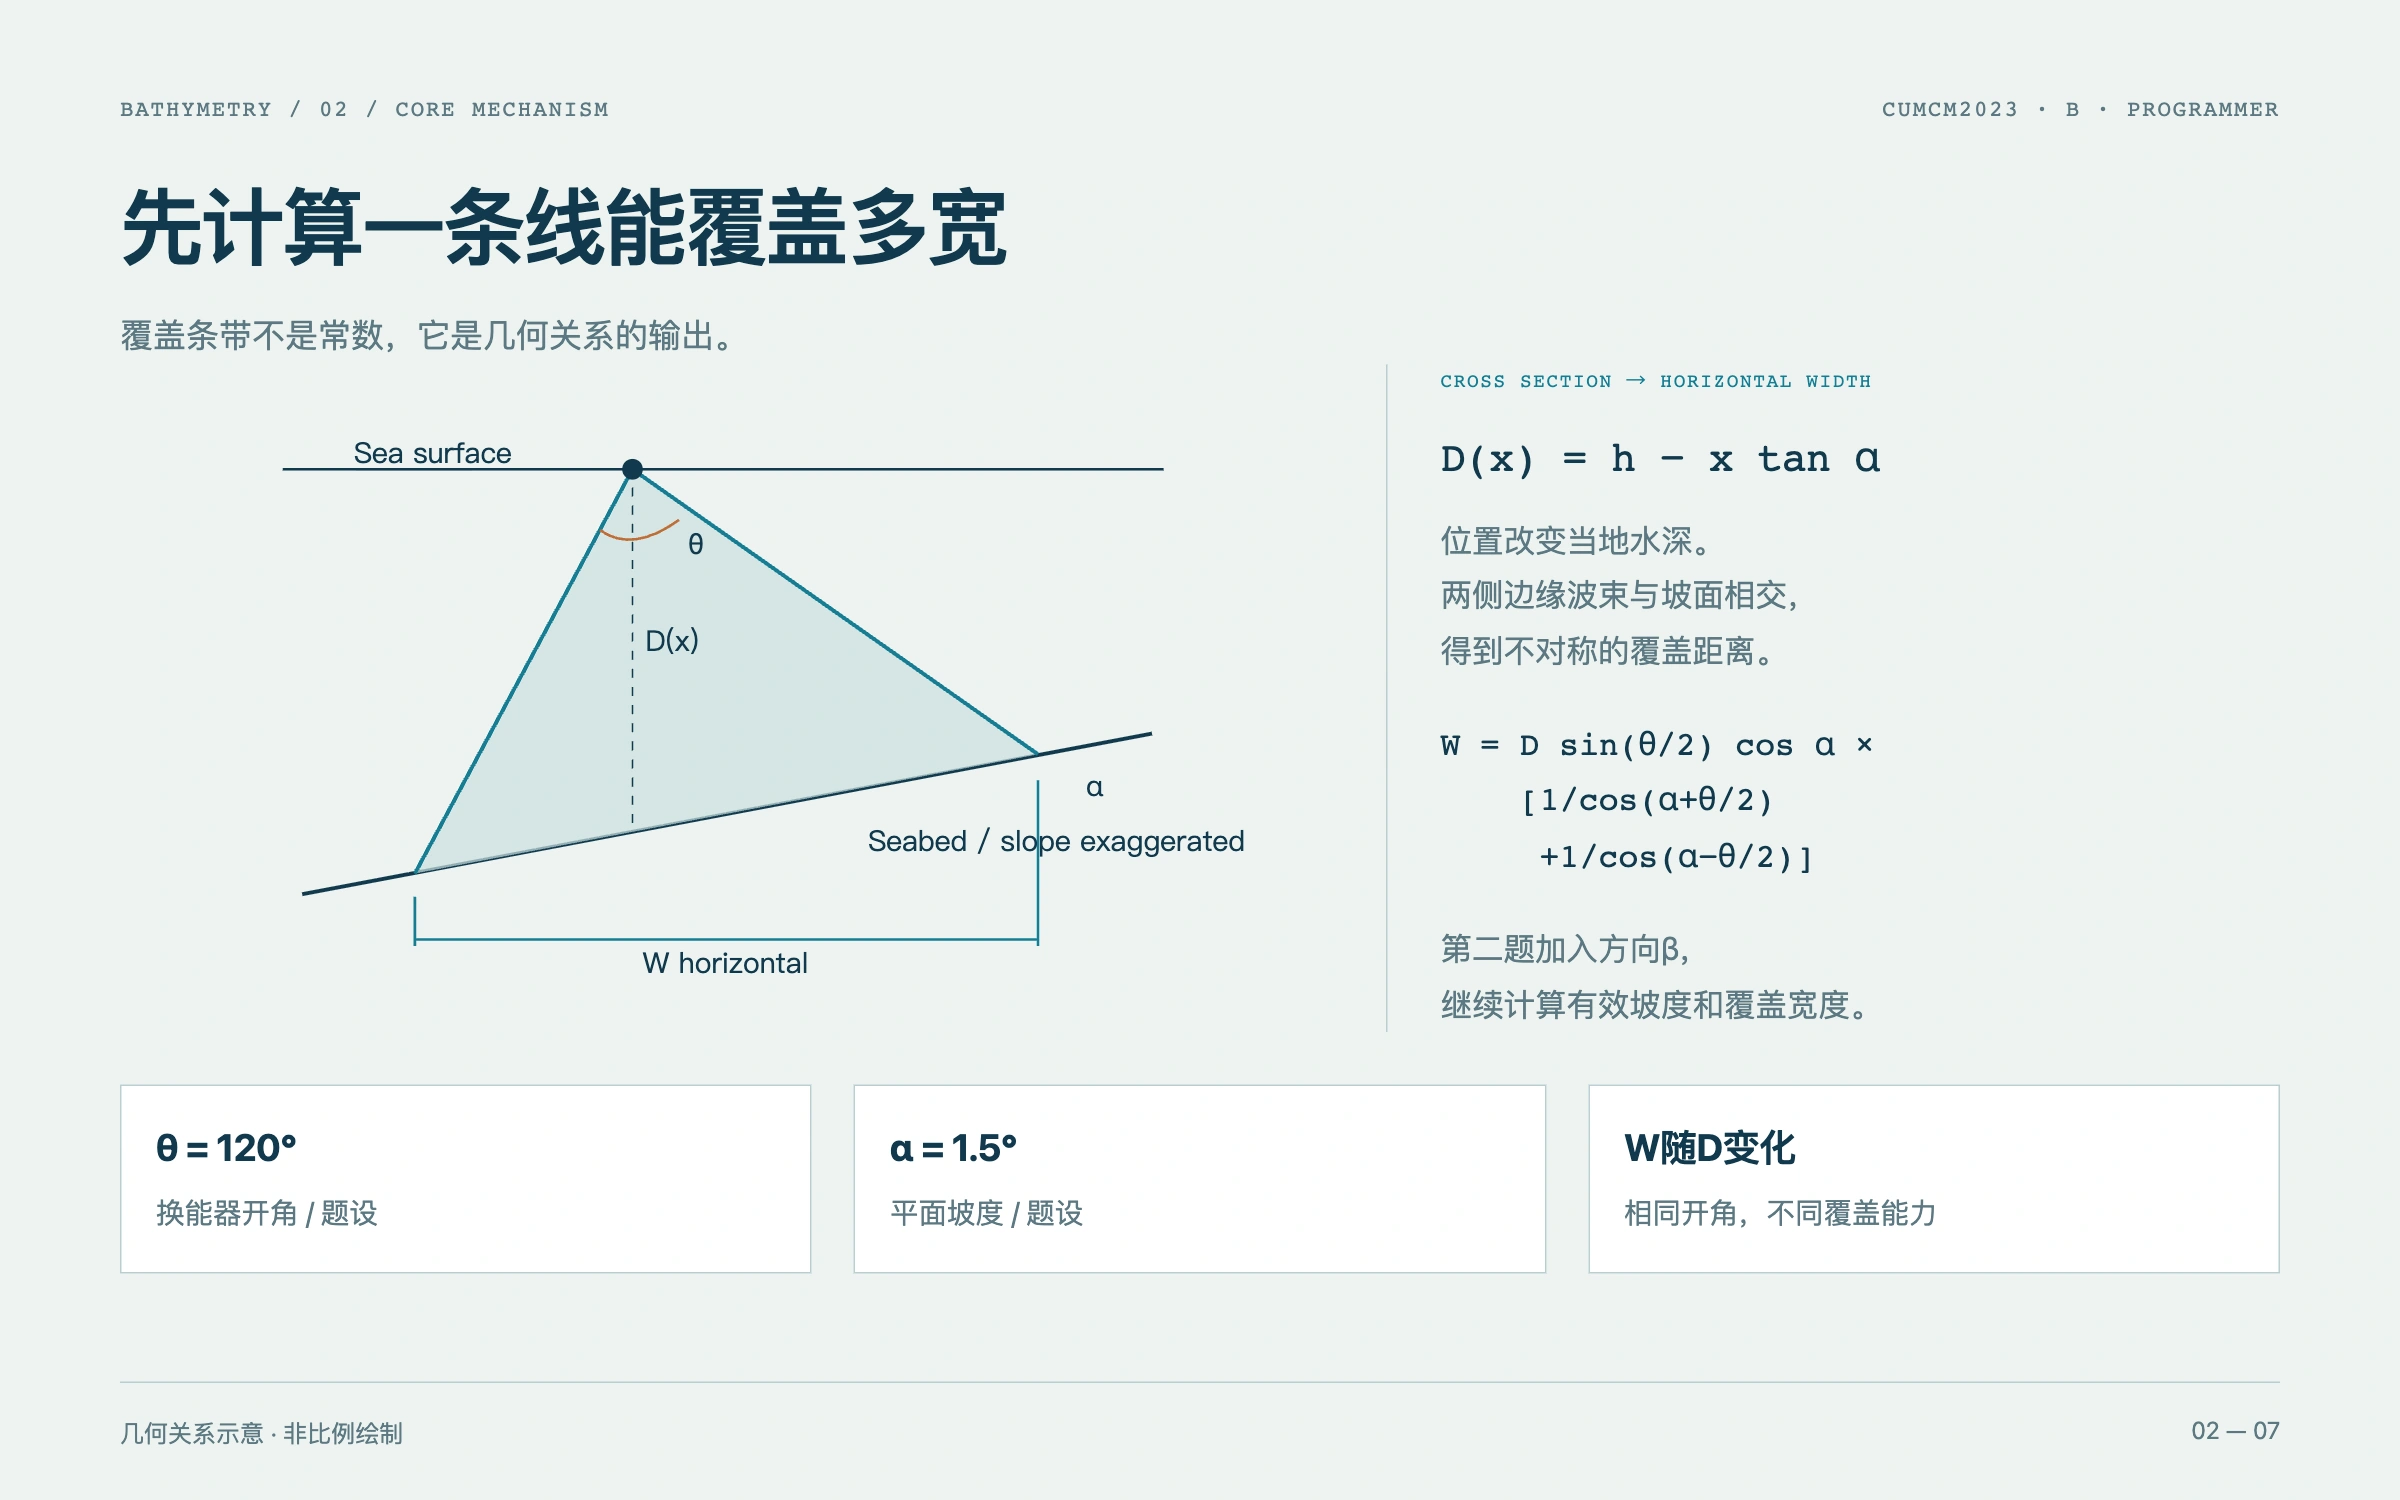
Coverage width and the next survey line
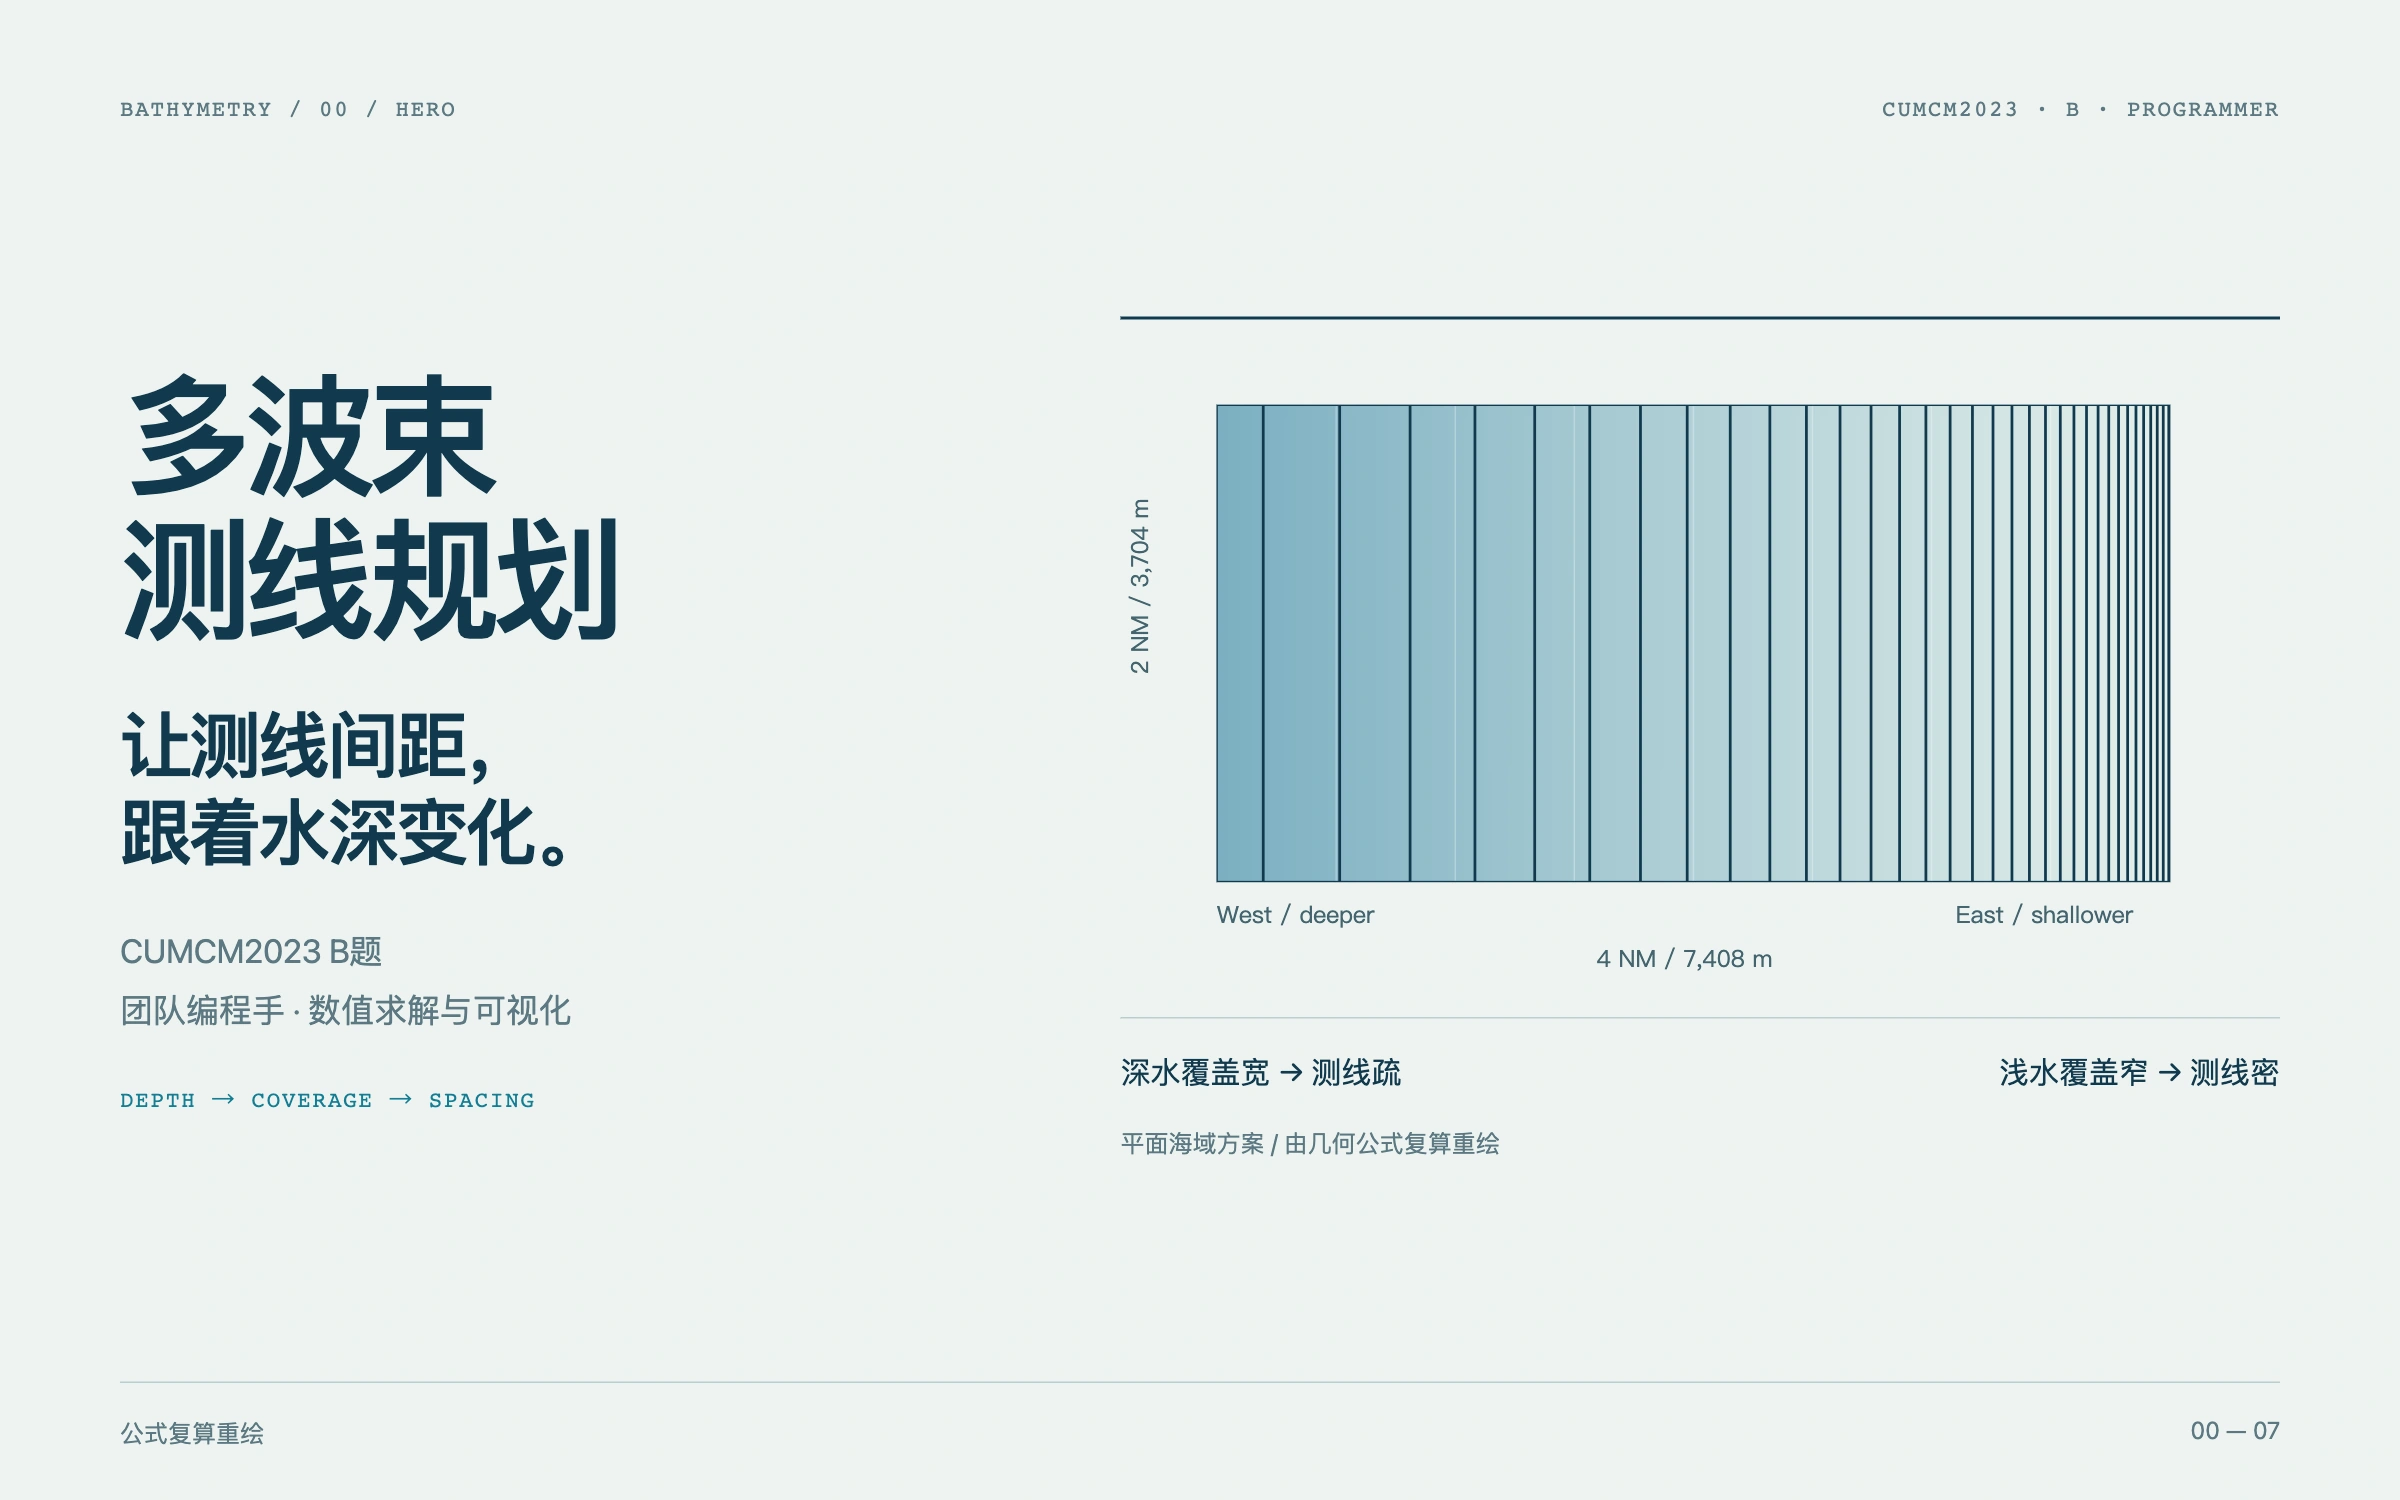
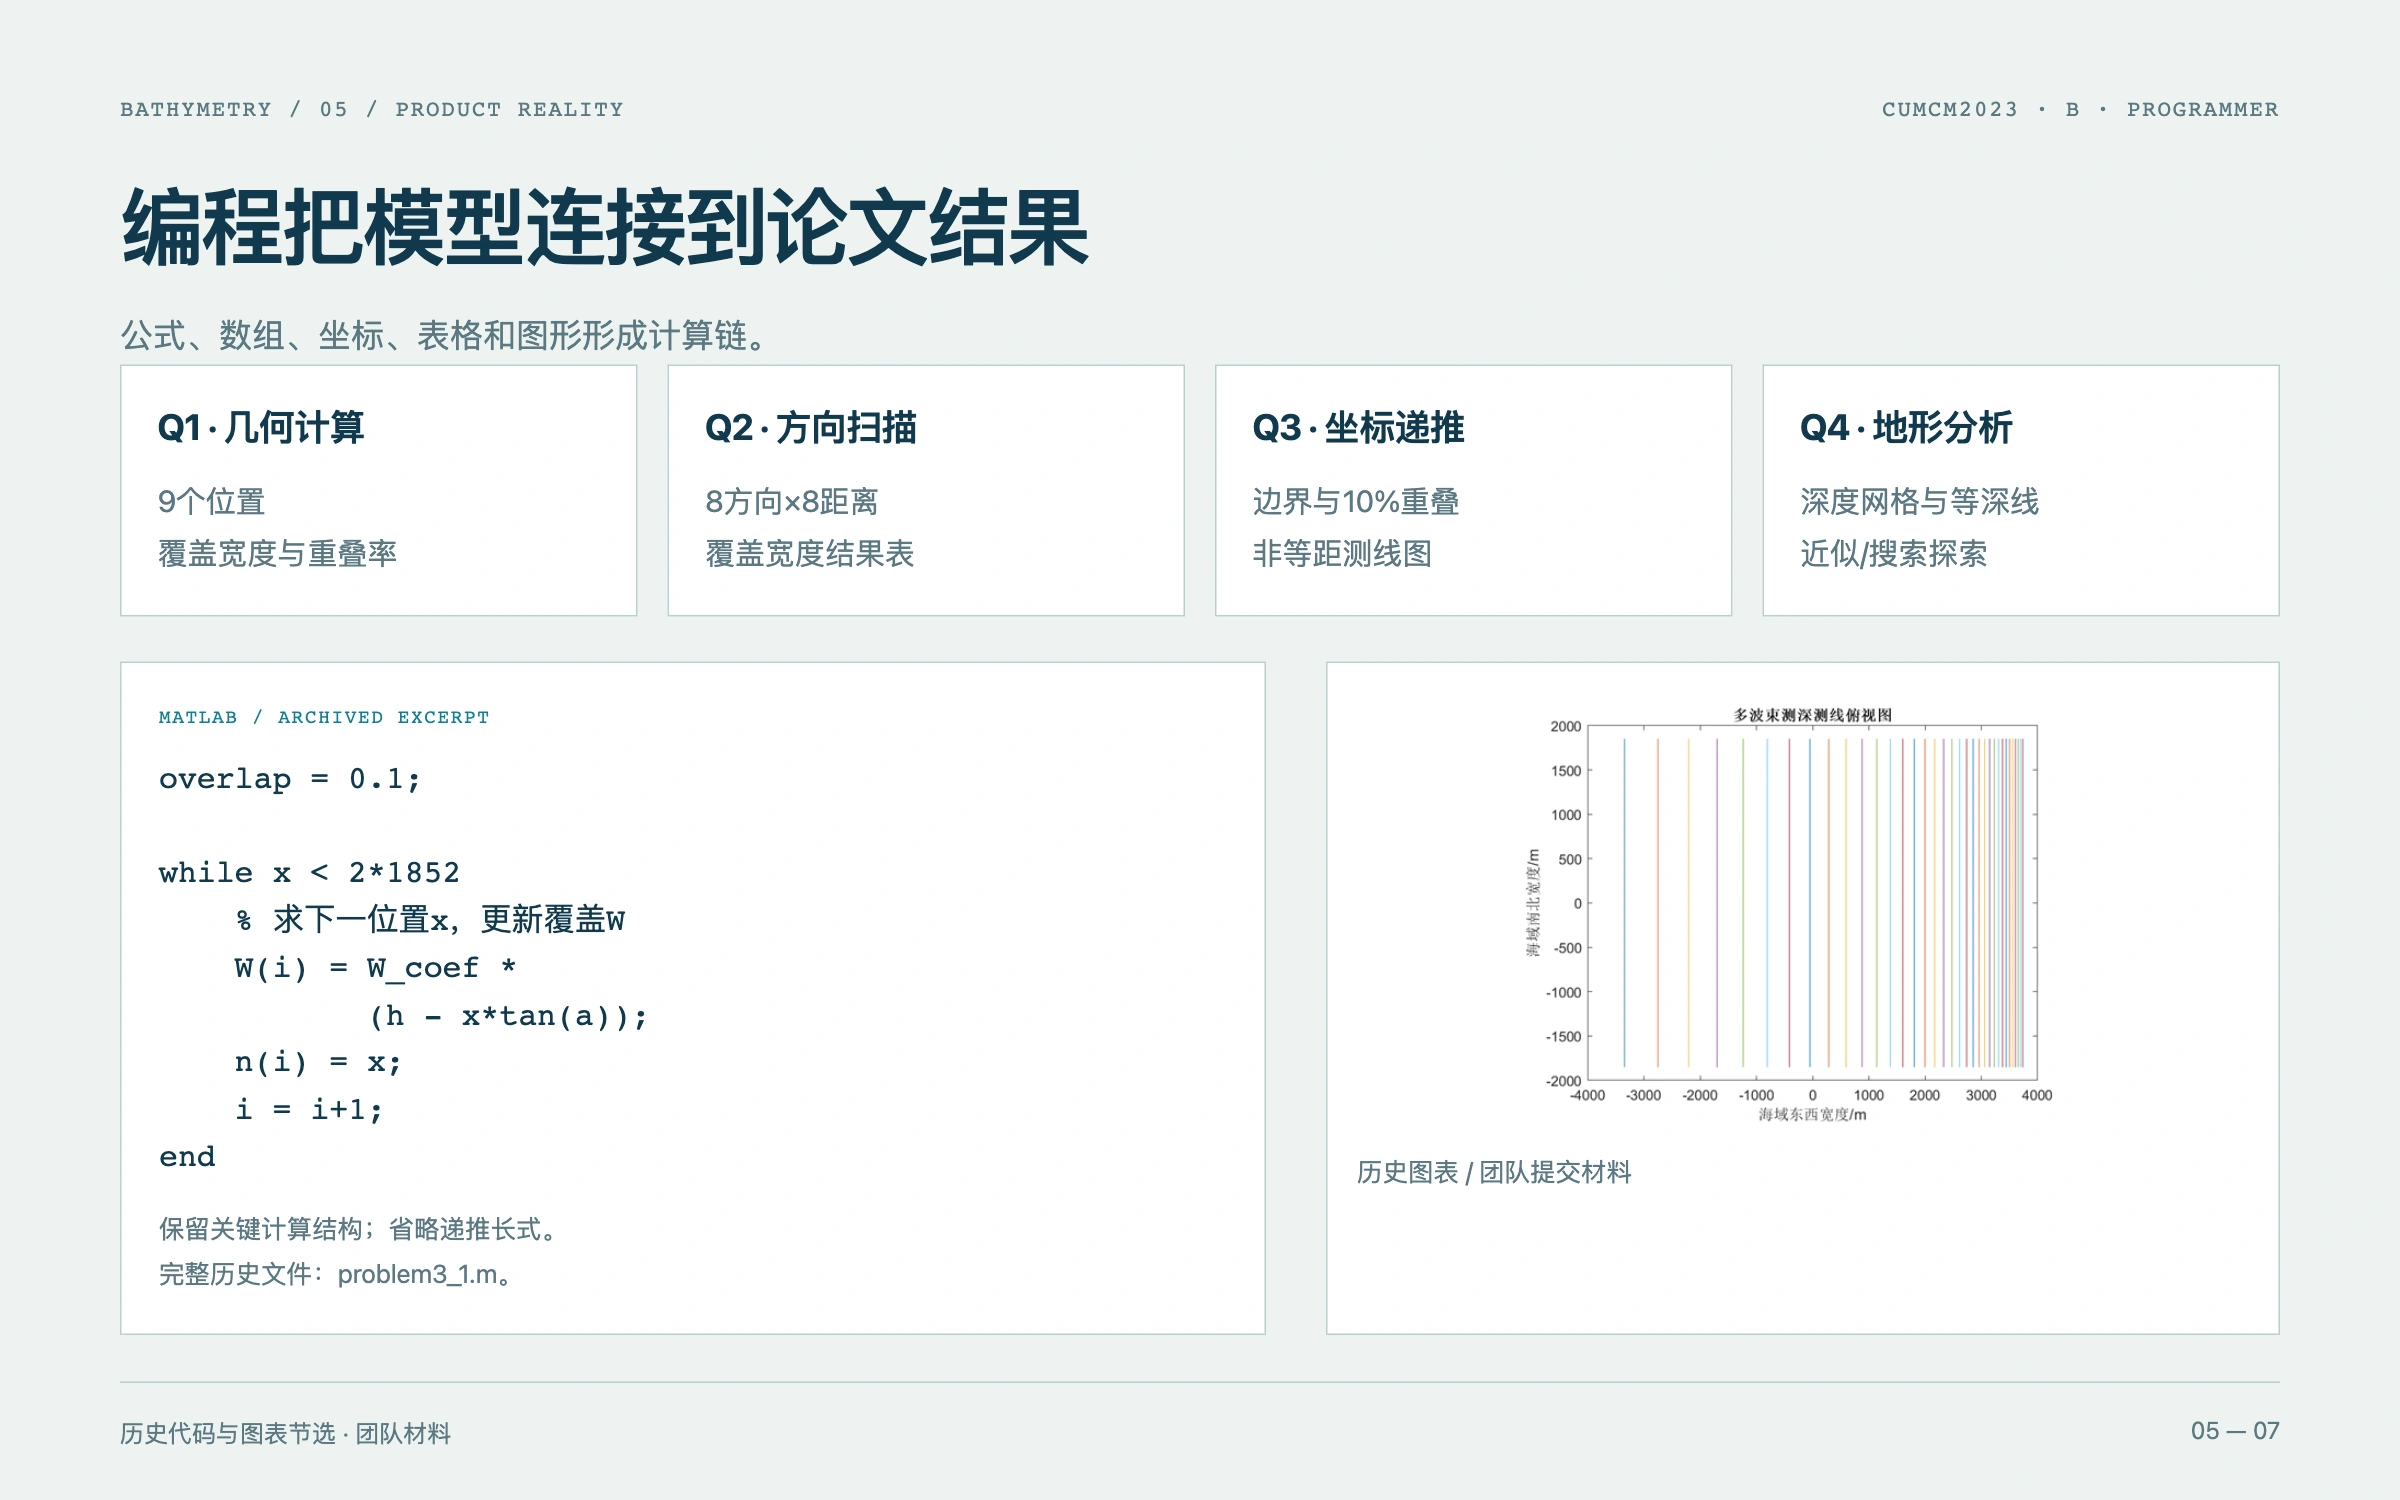
The team derived left and right beam intersections and their horizontal projections, then considered direction-dependent slope. Programming turns these relationships into parameters and result tables. On an ideal inclined plane, an anchored western boundary and a 10% overlap recurrence produce progressively denser lines as the water becomes shallower.
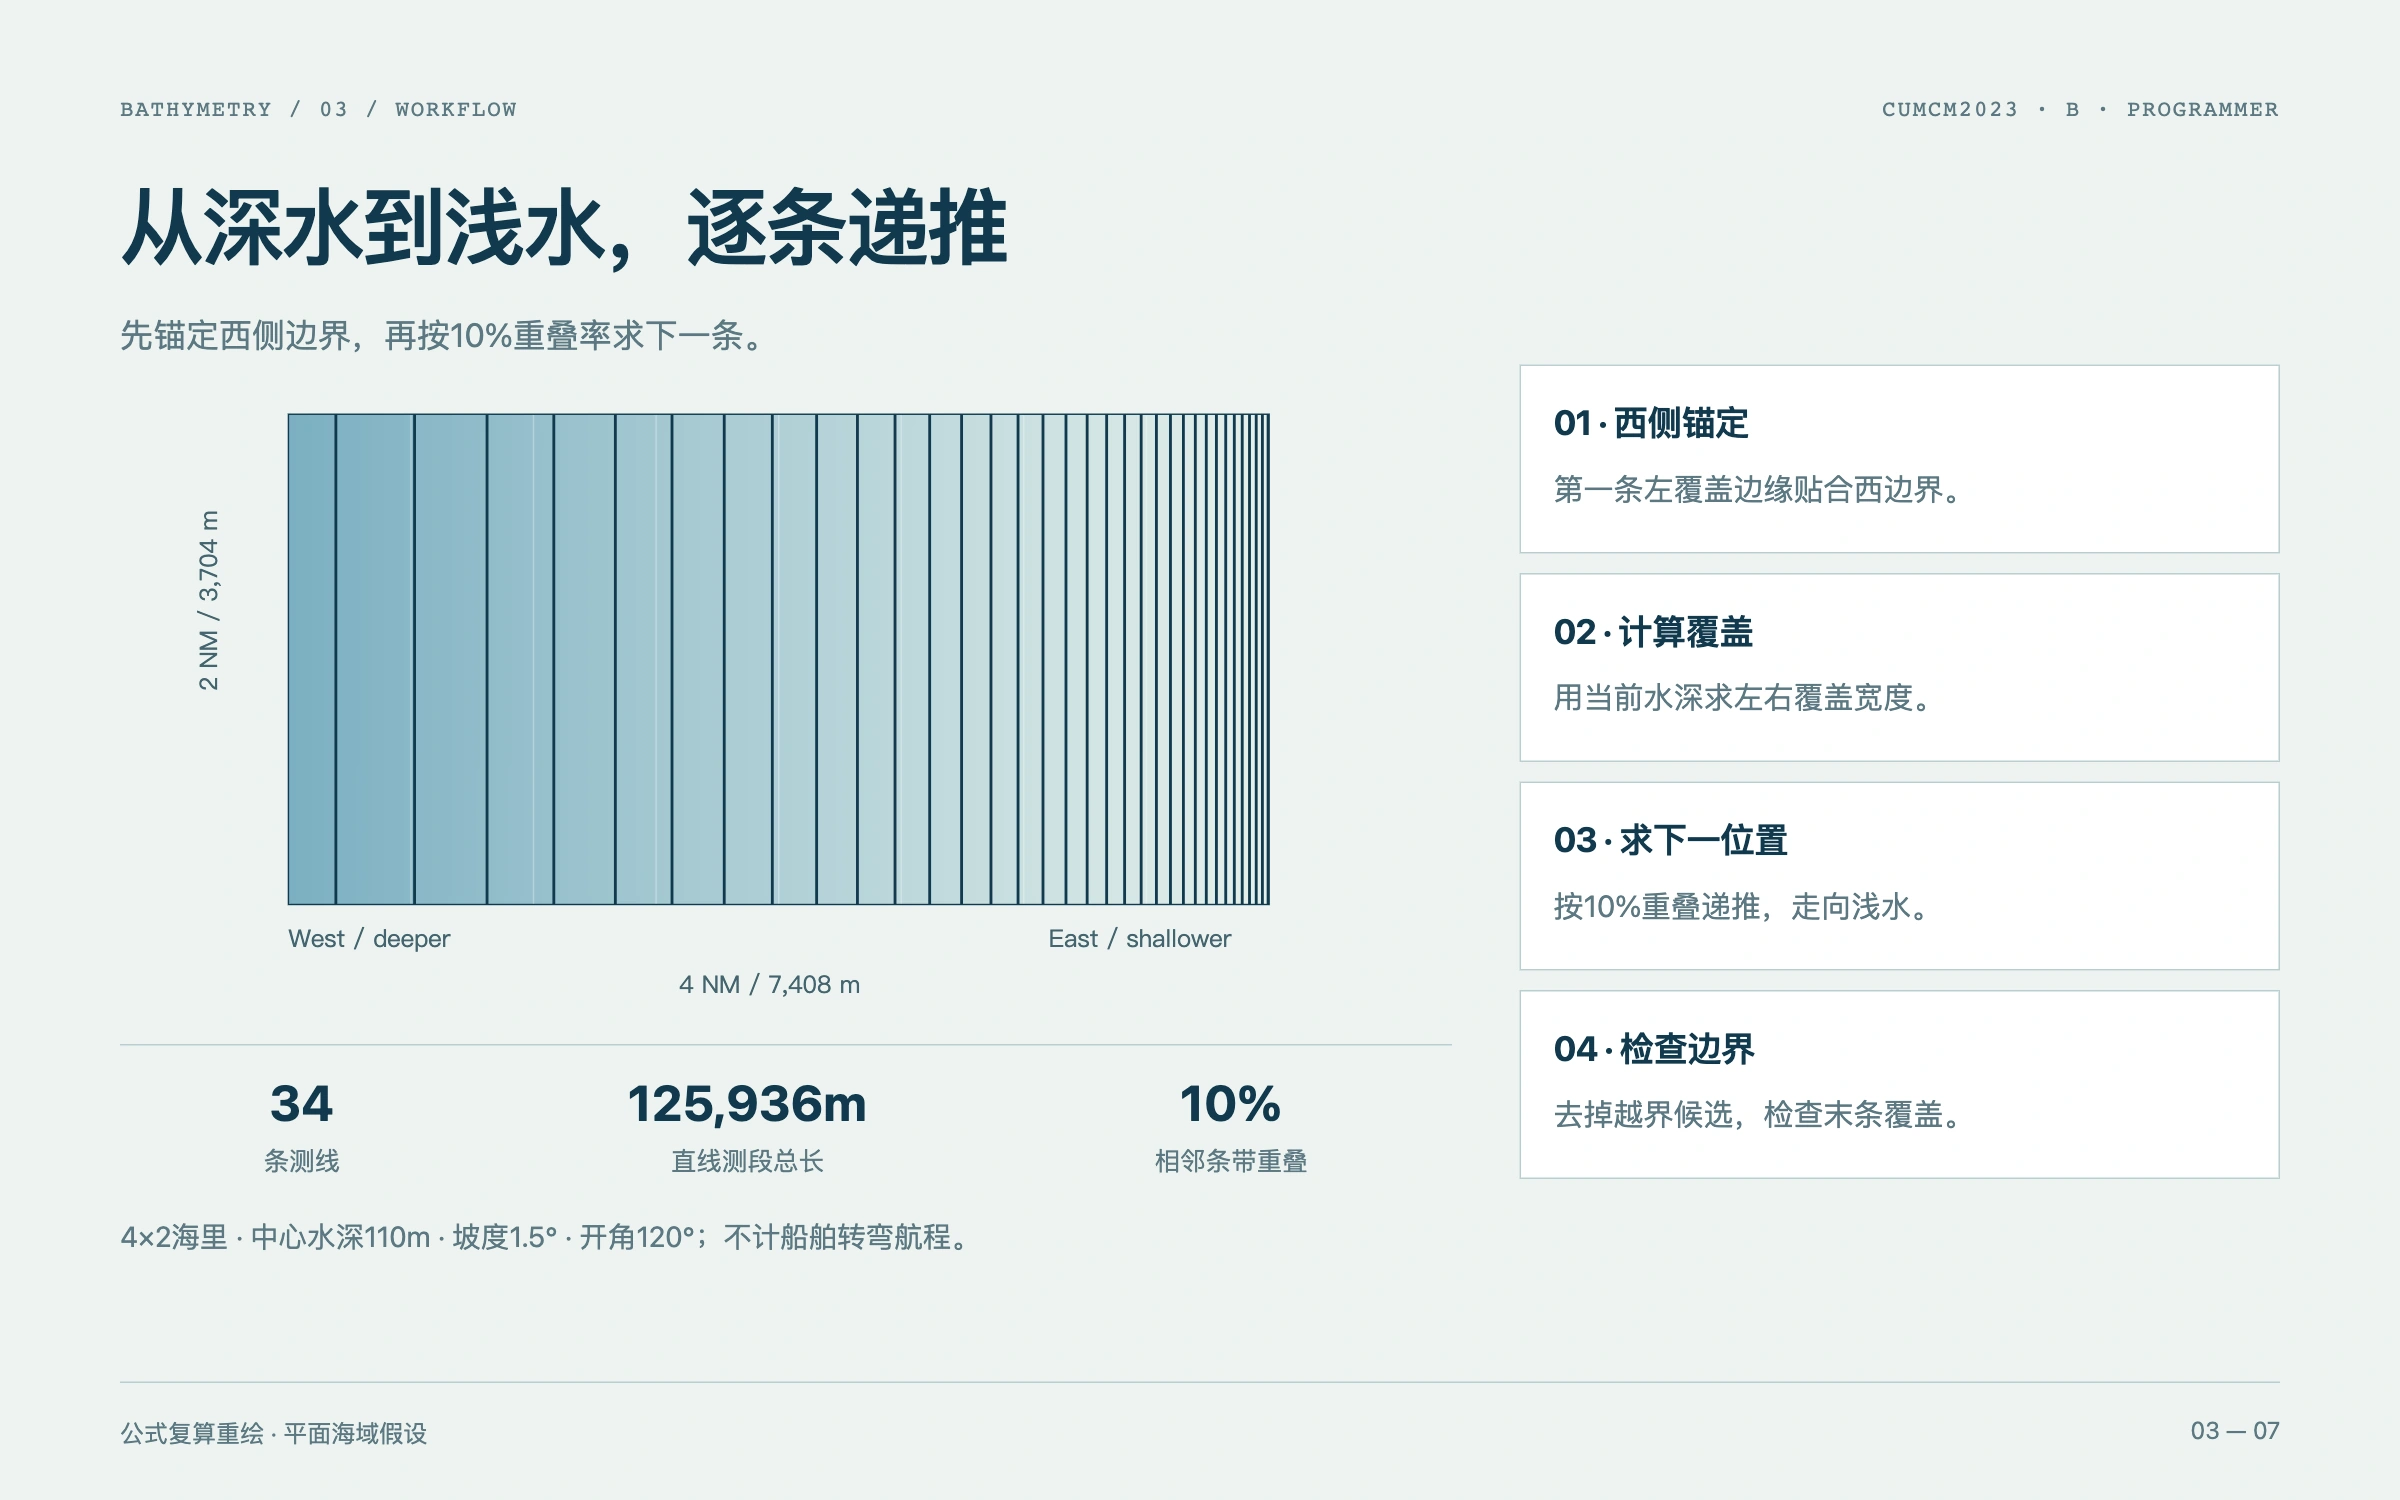
Coordinates and layout on a planar seabed
For a 4-by-2 nautical-mile planar region, 110m central depth, 1.5-degree slope, and a 120-degree beam angle, the recurrence yields 34 north-south lines. Each is 3704m long, totaling 125936m of straight survey segments. The result excludes turns and remains a fixed-direction solution, without a global optimality claim.
Approximating curved terrain
The supplied 251-by-201 depth grid introduces a varying seabed. Contours expose depth changes; the team paper uses a two-plane approximation, while code retains interpolation and search explorations. The terrain comes from the competition dataset rather than our own survey, and approximation tradeoffs must remain explicit.

My numerical calculations and visualizations
As the team programmer, I contributed numerical calculations, tables, and two- and three-dimensional visualizations. Retained materials include MATLAB geometry and line recurrence plus Python processing, direction scanning, and search explorations. Modeling, the paper, and competition outcomes remain team work.
Results for different terrains
The planar solution and the complex-region paper results are shown separately. The latter reports 71616.3m of lines, 6.93% unmeasured area, and 4819.77m above 20% overlap. These costs belong together: a shorter route does not establish a universal improvement or complete coverage.

What I learned from the programming work
The experience connected units, assumptions, geometry, code, and visual explanation. My contribution was to make the constraints produce inspectable coordinates and charts, then explain the conditions under which those outputs hold. This turns a computed layout into a proposal the team can evaluate.